
HOUSING MARKET REVIEW
How have the values changed in my neighborhood? Below are the median sales prices for five popular Detroit suburbs in May 2025, along with the % change over the past 12 months.
Troy - $490,000 (+8.9%)
Macomb Township - $490,000 (+7.3%)
St Clair Shores - $242,250 (+5.3%)
Royal Oak - $357,000 (+3.2%)
Grosse Pointe Woods - $340,000 (+1.5%)
At the national level many markets have shifted to a balanced or even buyer favored environment. The headlines from national news organizations are eye catching and sometimes even alarming (remember in the news business, fear sells). Below is the data for our market in Metro Detroit. Inventory is certainly continuing to rise, giving buyers more options, and sellers less power, but it is still a seller's market. While homes for sale has nearly doubled in the last 24 months nationally, in Metro Detroit we're still -41% lower than in 2019 (pre-pandemic). We'll continue to track this throughout the year, and see how things evolve.
Reminder: these data points are always a 12 month average to remove seasonality.


Graphic 1. Median Sales Price (12 mo rolling data | % on right compares the past 12 months to the previous 12 months)
Graphic 2. Homes For Sale (12 mo rolling data | % on right compares the past 12 months to the previous 12 months)
Mortgage MARKET REVIEW
'"The President has been saying this for a while, but it's even more clear; the refusal by the Fed to cut rates is monetary malpractice."
- VP Vance
Like almost every aspect of politics these days, this is largely rhetoric. Every administration wants to cut rates, acutely boost the economy, and win over prospective voters. Mortgage rates have stayed fairly stable overall for the past 12 months, less the steep decline leading into the presidential election. One of the biggest factors for the future of mortgage rates will be the outcome of this escalating battle between the President and the head of the Federal Reserve.
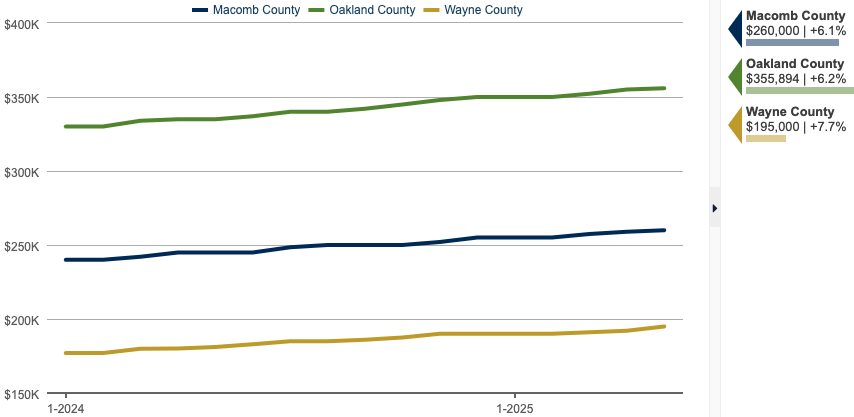


Graphic 1. Median Sales Price (12 mo rolling data | % on right compares the past 12 months to the previous 12 months)
Graphic 2. Homes For Sale (12 mo rolling data | % on right compares the past 12 months to the previous 12 months)
Graphic 3. 30 Yr Fixed Conventional Mortgage Rate (previous month)
Graphic 4. 30 Yr Fixed Conventional Mortgage Rate (previous year)